Click on the image to see a PDF version (for zooming in)
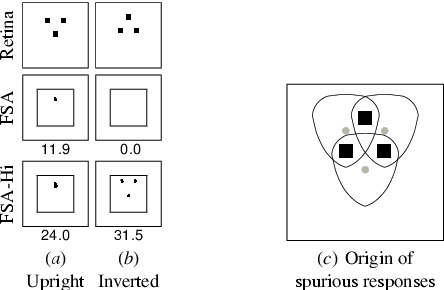
Fig. 10.8. Spurious responses to the inverted three-dot
pattern. Several studies have used an inverted three-dot pattern
as a non-facelike control for an upright three-dot pattern with
conflicting results (e.g. Johnson and Morton 1991; Simion et
al. 1998a; Valenza et al. 1996). However, the results with HLISSOM
show that this pattern does not make a good control, because of the
many axes of symmetry of a three-dot pattern. The first two rows in
(a) and (b) are reproduced from Figure 10.7a,i, and show that HLISSOM
prefers the facelike upright pattern to the control. However, the
preference is sensitive to the value of the FSA threshold
&thetal and the FSA input scale &gammaA. For
instance, if &gammaA is increased by 30%, the model FSA
responds more strongly to the inverted pattern (bottom row). The
inverted pattern is not as good a match for any single neuron's
weights, so the FSA activity spots are always smaller for the inverted
pattern. However, with a high enough &gammaA, the FSA
responds in three different places (b) compared with only one for the
upright pattern (a), and together the three small responses outweigh
the single larger response. Plot (c) demonstrates how such spurious
FSA responses arise in the model. These responses are shown
superimposed on the retinal pattern as three small dots, and the
outlines indicate the three-dot patterns that they represent. Each
pattern shares two dots with the inverted input, shown as three black
squares; these two shared dots are enough to activate the unit. In
HLISSOM, &gammaA is set to a value low enough to prevent
such spurious responses, which ensures that FSA neurons respond only
to patterns that are a good match to their (upright) RFs. For humans,
the &gammaA value represents the state of contrast
adaptation at a given time, which varies depending on the recent
history of patterns seen (Albrecht et al. 1984; Turrigiano
1999). Thus, these results suggest that infants will have no
preference (or will prefer the inverted pattern) if they are tested on
the high-contrast schematic patterns while being adapted to the lower
contrast levels typical of the environment. Because such adaptation is
difficult to control in practice, the inverted pattern is a
problematic comparison pattern -- negative results like those of
Johnson and Morton (1991) may be due to temporary contrast adaptation
instead of genuine, long-term pattern preferences.
|

