Click on the image to see a PDF version (for zooming in)
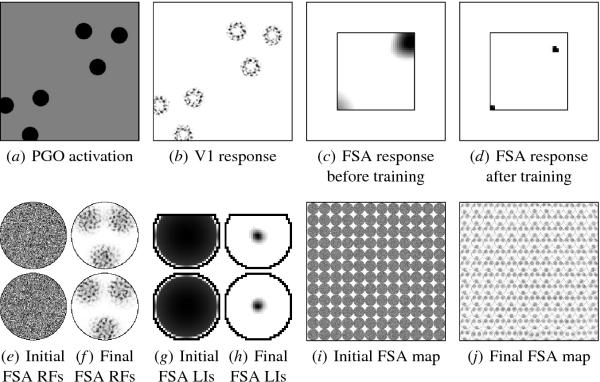
Fig. 10.5. Self-organization of the FSA map. The PGO activation
is shown in gray scale from black to white (low to high), and the V1
and FSA activities and the afferent and lateral weights in gray scale
from white to black (low to high). (a) Each input pattern consisted of
two dark three-dot configurations with random nearly vertical
orientations presented at random locations on the PGO sheet. (b) The
V1 neurons compute their responses based on this input, relayed
through the LGN. (c) FSA neurons initially respond to any activity in
their receptive fields, but after training (d), only neurons with
closely matching RFs respond. In the FSA plots, the inner square
represents the FSA and is drawn to scale with the retina. The outer
square is provided to help locate the FSA responses on the retina, as
was done in Figures 4.4 and A.1a. Through self-organization, the FSA
neurons develop RFs selective for a range of V1 activity patterns like
those resulting from the three-dot stimuli (e and f , drawn in the
same scale as b for two sample neurons). The RFs are patchy because
the weights target specific orientation patches in V1. This match
between the FSA and the local self-organized pattern in V1 would be
difficult to ensure without training on internally generated
patterns. The FSA neurons also develop lateral inhibitory connections
with a smooth Gaussian profile (g and h, drawn in the same scale as c
and d for the two neurons in e and f ). Plots (i) and (j) show the
afferent weights for every third neuron in the FSA. All neurons
develop roughly similar weight profiles, differing primarily by the
position of their preferred stimuli on the retina and by the specific
orientation patches targeted in V1. The largest differences between
RFs are along the outside border, where the neurons are less selective
for three-dot patterns. Overall, the FSA develops into a face
detection map, signaling the location of facelike stimuli.
|

