In a suite of simulation experiments we compared the proposed new method for end-to-end delay analysis with that of two commonly used methods ([8, 9]), which we call Algorithm Decomposed and Algorithm Service Function. These methods were originally proposed by Cruz and adopted in various forms by many others. We compare their performance on a network with FIFO servers arranged in a feedforward topology. These experiments show that our new method generally computes tighter bounds on end-to-end delays than the other approaches.
We evaluate the performance of the new approach by comparing Algorithm Integrated to the delay computation methods described by Cruz in [8, 9], which we call Algorithm Cruz. In this section, we first define the performance metric and then describe the system configuration considered. The performance results will be presented and discussed in the next section.
In our evaluation, we consider a simple tandem network with n
![]() switches, which are connected in a chain.
switches, which are connected in a chain.

Figure 3: A Tandem Network.
An example of such a tandem network with 5 switches is illustrated in Figure 3. There are 2n+1 connections in this network. Connection 0 is the longest; it enters the network at the middle input port of the first switch and exits the network from the middle output port of the n-th switch. For k=0 to n-1, the (2k+1)-th session enters the network by the upper input port of the k-th switch and exits the network from the upper output port of the (k+1)-th switch, the (2k+1)-th session enters the network by the lower input port of the k-th switch and exits the network from the upper lower output port of the (k+2)-th switch. The middle output port of each switch, excepted the first one, carries four connections, including Connection 0.
In order to simplify the evaluation, we assume that every source
traffic is controlled by a token bucket with a unit bucket size
( ![]() ) and the token arrival rate
) and the token arrival rate ![]() , where
U is the work load of the network. While an increase of the traffic
burstiness (larger value for
, where
U is the work load of the network. While an increase of the traffic
burstiness (larger value for ![]() ) increases the overall
end-to-end delays, our experiments indicate that it does not affect
the relative performance of the approaches evaluated in these
experiments. In particular, increasing the traffic burstiness has no
effect on the relative improvement
) increases the overall
end-to-end delays, our experiments indicate that it does not affect
the relative performance of the approaches evaluated in these
experiments. In particular, increasing the traffic burstiness has no
effect on the relative improvement ![]() (defined below) for any
pairing of methods.
(defined below) for any
pairing of methods.
We quantify the performance of algorithms using two measures.
One is the end-to-end delay ![]() estimated by
Algorithm X for the end-to-end delay suffered by the connection
which travels the longest path in the network (Connection 0 in our
case) under the work load U.
The other is called the relative improvement
estimated by
Algorithm X for the end-to-end delay suffered by the connection
which travels the longest path in the network (Connection 0 in our
case) under the work load U.
The other is called the relative improvement ![]() , which
is used to compare two algorithms and is expressed as
, which
is used to compare two algorithms and is expressed as
![]()
In the Appendices B and C we summarize the formulas used for the delay calculation in the decomposition based and service-curve based approach as described in [8, 9, 10, 5, 31]. We use these formulas to derive closed forms for the worst-case delay for Connection 0 in the topology used in these experiments. We call the resulting delay computation algorithms Algorithm Decomposed for the decomposed approach and Algorithm Service Curve for the service-curve based approach.
We derive the worst-case end-to-end delay of Connection 0 by adding
the local delays on the servers along its path. For this, we let
![]() be the local delay suffered by traffic of Connection ) at
Server k. In Appendix B we derive the
following equations for
be the local delay suffered by traffic of Connection ) at
Server k. In Appendix B we derive the
following equations for ![]() :
:
![]()
The end-to-end delay ![]() for Connection 0 using Algorithm
Decomposed is then obtained by adding the local delays:
for Connection 0 using Algorithm
Decomposed is then obtained by adding the local delays:
![]()
The delay calculation in this approach is based on the definition for
the service curve given in Equation C.26. As we compare the
performance of the various approaches for a network with pre-defined
servers (FIFO servers in this case), synthesizing scheduling
algorithms from pre-defined service curves is not viable. We must use
an induced service curve approach, where we derive the service curve
from the scheduling policy used in the server. The performance of
such a method, however, greatly depends on how tight service curves can
be defined for a given service discipline. In Appendix C
we derive an upper bound on the service curve for a FIFO server,
which in turn give raise to a lower bound for the end-to-end delay
![]() for Connection 0 with the service curve method. As we
derive in Appendix C, the worst case delay
for Connection 0 with the service curve method. As we
derive in Appendix C, the worst case delay ![]() is
lower-bounded by the following expression:
is
lower-bounded by the following expression:
![]()
It is important to emphasize at this point that the following comparisons are between upper bounds on end-to-end delays for both Algorithm Integrated and Algorithm Decomposed, and lower bounds for Algorithm Service Curve. The results for the performance of Algorithm Service Curve, both in terms of end-to-end delays and in terms of relative performance, must therefore be considered as optimistic.
The results of our experiments comparing the performance of the three
approaches are depicted in Figures (4),
( ), and (6).
Figure 4 compares the service-curve based approach
to the decomposition-based approach and illustrates how the former is
not well suited (as was to be expected) for analyzing
non-guaranteed-rate service disciplines, in this case FIFO.
As the network load increases, the inadequacy of modeling a FIFO
server with a service curve becomes evident. For larger systems,
this gets partly offset by the compounding effects of summing
convervative local delay bounds in the decomposition-based approach.
From Figure 5 we see that Algorithm Integrated always outperforms Algorithm Decomposed. Furthermore, for loads up to 80%, the performance improvement increases with growing network size. This is expected as Algorithm Integrated takes delay dependences within server pairs into account.
While the performance improvement of Algorithm Integrated over Algorithm Service Curve can be inferred by transitivity, we show a comparison in Figure 6 for illustrative purposes. The results of this experiment show that the performance gains are significant, eccept for large systems under high load.
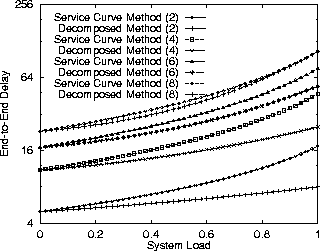
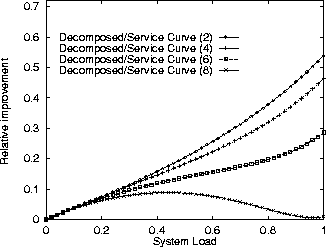
Figure 4: Comparison between Decomposed Method and Service Curve Method.
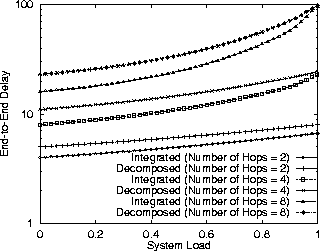
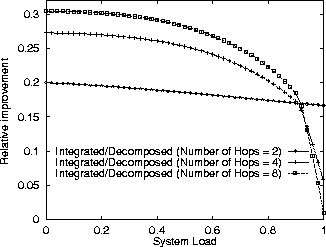
Figure 5: Comparison between Integrated Method and Decomposed Method.
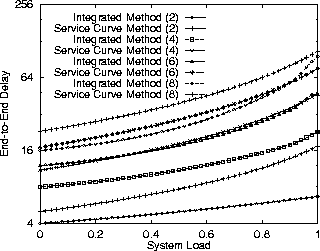
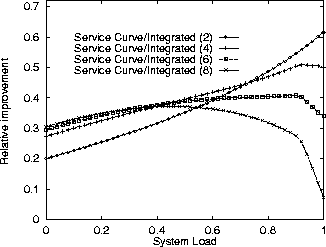
Figure 6: Comparison between Integrated Method and Service Curve Method.