PGLISSOM: Contour Integration/Segmentation
Demo
The following animations are demos constructed from
the simulations specified in the following paper, which is a slightly updated
version of the original results reported in my Ph.D. dissertation:
Yoonsuck Choe and
Risto Miikkulainen.
Contour
integration and segmentation in a self-organizing map of spiking
neurons.
Biological Cybernetics, 90:75-88, 2004.
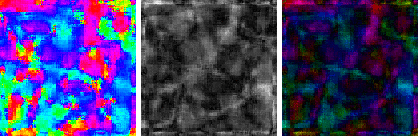
- Self-organization of orientation maps: the left plate is the orientation
preference, the center plate is the orientation selectivity (black is low, white
is high), and the right-most plate is the combined preference-selectivity.
Each animation starts from iteration 0 and ends at iteration 40,000, and loops.
- Contour integration: The contour integration inputs and the spike
activity of MAP2 for 600 iterations are shown for each input configuration.
The degree of synchrony within each area of the map responding to the
oriented Gaussian inputs were measured. See the paper for more detail on
the results. For the configurations with less orientation jitter, the
population of neurons responding to the oriented Gaussians are more
consistently synchronized. If it is hard to see what's going on, first see the
contour segmentation demo at the end of this page.
- 0-degree


- 30-degrees


- 50-degrees


- 70-degrees


- Contour Segmentation: when two (or more) equally salient contours are present in the scene, the alternating phase of synchronized spikes is more prominent.


Mon May 13 00:21:11 CDT 2002