Click on the image to see a PDF version (for zooming in)
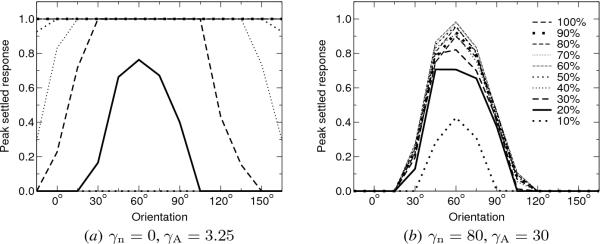
Fig. 8.3. Effect of afferent normalization on V1 neuron tuning.
The differences in V1 population activities shown in Figure 8.2 are
due to changes in how individual neurons respond at different
contrasts. These plots show orientation tuning curves of the neuron at
the center of the cortex, which prefers stimuli oriented at
60o. Each curve shows the peak settled responses of this
neuron to sine gratings whose orientations are indicated in the x-axis
and contrast specified in the legend at right. In each case, the sine
grating phase was used that resulted in the largest response. (a)
Without afferent normalization, the neuron becomes less selective for
orientation as contrast increases. Given enough contrast (above 50%),
the neuron responds at full strength to inputs of all orientations,
and thus no longer provides information about the input
orientation. (b) With normalization, the tuning curve is the same over
a wide range of contrasts, allowing the neuron to respond only to
inputs that match its orientation preference. The curves are similar
at 20% contrast (solid line), but the neuron now responds selectively
to other contrasts as well. Afferent normalization is therefore
crucial for preserving orientation selectivity over a wide range of
contrasts.
|

