Click on the image to see a PDF version (for zooming in)
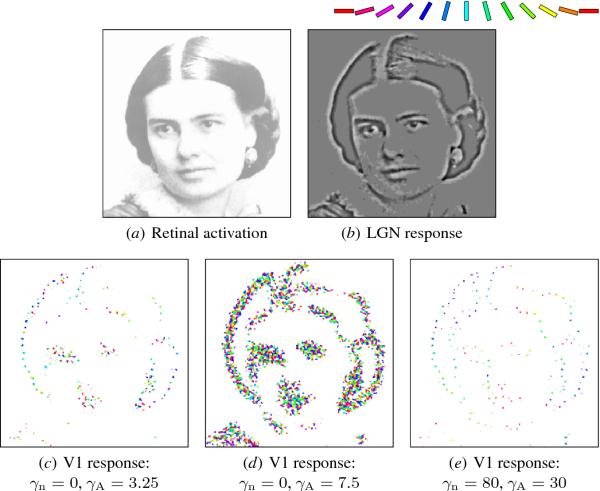
Fig. 8.2. Effect of afferent normalization on V1 responses. The
LGN response (b) to the activation in (a) is visualized by subtracting
the OFF channel activation from the ON, and the V1 responses (c-e) by
color coding each neuron according to how active it is and what
orientation it prefers (as in Figure 6.5, except this network, from
Section 10.2, is much larger). (c) Without afferent normalization
(&gamman = 0), the network can respond only to the
strongest contrasts in the image (as in Figure 6.5): The low-contrast
oriented lines, such as those along the bottom of the chin, are
lost. (d) When the afferent scale (&gammaA) is increased,
the network begins to respond to these lines as well, but its
activation resulting from the high-contrast contours becomes
widespread and unselective. (e) With normalization (&gamman
= 80, &gammaA = 30), the responses are largely invariant to
input contrast, and instead are determined by how closely the input
pattern matches the receptive field pattern of each neuron. The
activations preserve the important features of the input, and the V1
activation pattern can be used as input to a higher level map for
tasks such as face processing. Afferent normalization is therefore
crucial for producing meaningful responses to natural inputs, which
vary widely in contrast. Figure 8.3 shows how afferent normalization
affects the responses of single neurons, which underlie these
differences in the V1 response.
|

