Click on the image to see a PDF version (for zooming in)
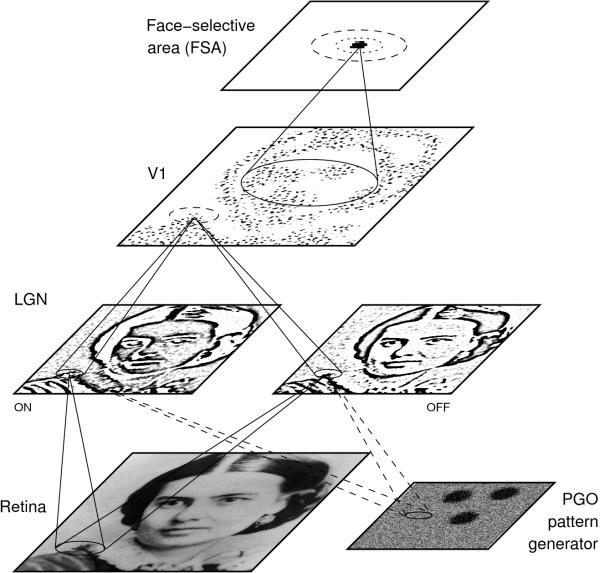
Fig. 8.1. Architecture of the HLISSOM model. Each sheet of
units in the model visual pathway is shown with a sample activation
pattern and the connections to one example unit. The activities are
shown in gray scale as in Figure 4.1. Visual inputs are presented on
the retina, and the resulting activity propagates through afferent
connections to each of the higher levels. Internally generated PGO
input propagates similarly to visual input. Activity in the model at
any one time originates either in the PGO sheet or the retina, but not
both at once. As in the LISSOM model, the activity in the cortical
levels (V1 and FSA) is focused by lateral connections, which are
initially excitatory between nearby neurons (dotted circles) and
inhibitory between more distant neurons (dashed circles). The final
patterns of lateral and afferent connections in the cortical areas
develop through an unsupervised self-organizing process, as in
LISSOM. After self-organization is complete, each stage in the
hierarchy represents a different level of abstraction. The LGN
responds best to edges and lines, suppressing areas with no
information. The V1 response is further selective for the orientation
of each contour; the response is patchy because neurons preferring
other orientations do not respond. The FSA represents the highest
level of abstraction -- a neuron in the FSA responds when there
appears to be a face in its receptive field on the retina.
|

