Click on the image to see a PDF version (for zooming in)
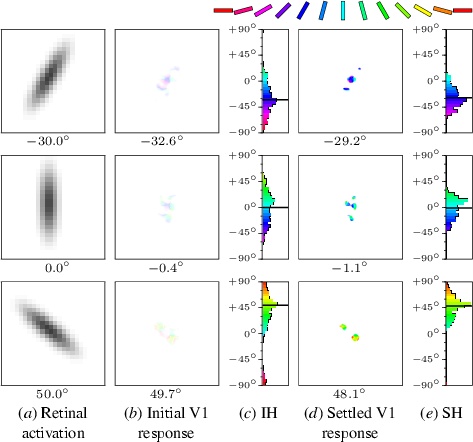
Fig. 7.4. Cortical response and perceived orientation. The V1
responses of the LISSOM orientation map are shown for three oriented
Gaussians, at -30o, 0o, and +50o from
vertical. As in the activity plots of Figure 6.5, the colors in the
response plots (b,d) represent the orientation preference of each
activated neuron, and the saturation (i.e. brightness) represents its
activation level. The numbers below each of these plots indicate the
perceived orientation, computed from orientation and activation values
using the vector sum method. These values are also shown using black
horizontal lines in histograms (c,e). The initial V1 response (b) is
based on the afferent weights only, before the lateral
interactions. The initial response histograms (IH; c) show that a
broad range of orientations are activated, and that this distribution
is approximately centered around the input's orientation. The location
of the response in the activity plots corresponds to the location of
the pattern on the retina. After settling, the activity is more
focused both spatially and in orientation, as seen in the map activity
plots (d) and their histograms (SH; e). The perceived orientation
remains an accurate estimate of the actual orientation of the input
pattern. An animated demo of this process can be seen at ...
|

