Click on the image to see a PDF version (for zooming in)
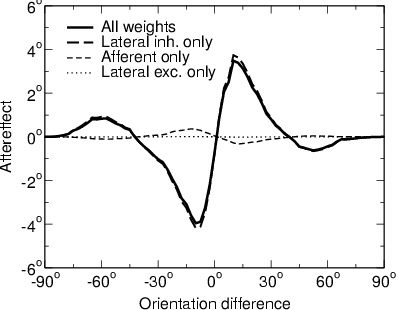
Fig. 7.7. Components of the tilt aftereffect due to each weight
type. The solid line represents the magnitude of the TAE for a
single trial from Figure 7.5. This trial was at the center of the
retina, and is typical of the effect seen at the other 15
locations. The other curves illustrate the contribution from each
different weight type separately. Other than the learning rates for
these weights, the parameters were identical in each case. The line
with short dashes represents the contribution from the afferent
weights (&alphaA = 0.000005; &alphaE =
&alphaI = 0). This contribution is minor and in the
direction opposite to the overall TAE curve. The dotted line
represents the contribution from the lateral excitatory weights
(&alphaE = 0.000005; &alphaA =
&alphaI = 0). It is in the same direction as that of the
afferent weights, but so small it can hardly be seen (the x axis is
not shown because it would have covered up this line). The line with
long dashes represents the inhibitory contribution (&alphaI
= 0.000005; &alphaA = &alphaE = 0). These
weights clearly determine the shape of the overall curve, although it
is slightly reduced in magnitude by the afferent contribution.
|

