Click on the image to see a PDF version (for zooming in)
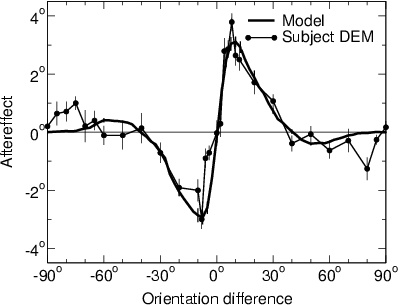
Fig. 7.5. Tilt aftereffect in humans and in LISSOM. The LISSOM
network adapted to a vertical (0o) line at the center of
the retina for 90 iterations, and the TAE was measured for test lines
oriented at each angle. The thick line shows the average magnitude of
the TAE over nine trials, as described in Section 7.2.2. Positive
values of aftereffect denote a counterclockwise change in the
perceived orientation of the test line. The graph is roughly
anti-symmetric around 0o, i.e. the TAE is essentially the
same in both directions relative to the adaptation line. The error
bars indicate ±1 SEM; in most cases they are too small to be visible
because the TAE was highly consistent between different runs (Appendix
B.2). For comparison, the thin line with circles represents the TAE,
averaged over 10 trials, for the single human subject (DEM) with the
most complete data in the Mitchell and Muir (1976) study. The LISSOM
TAE curve closely resembles the human TAE curve, showing both direct
and indirect tilt aftereffects. Reprinted from Bednar and Miikkulainen
(2000b).
|

