Click on the image to see a PDF version (for zooming in)
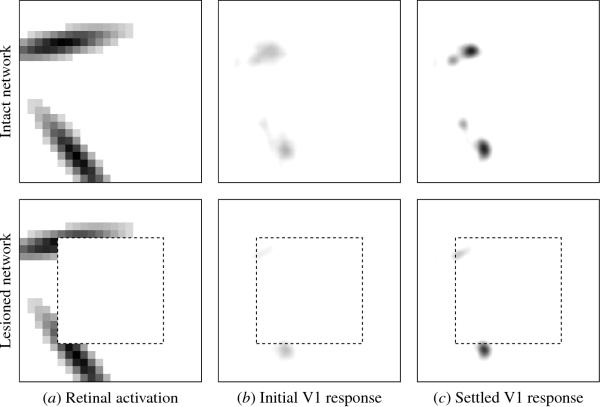
Fig. 6.6. Retinal activation and V1 response before and after a
retinal scotoma. The initial and settled responses of the intact
network (top row) and the lesioned network (bottom row) to input in
(a) are shown in (b) and (c). The activations are displayed in gray
scale from white to black (low to high; the orientation preferences of
active V1 neurons are not shown). The retinal lesion is simulated by
setting the activity of a set of receptors to zero, as shown in the
bottom row of (a). The dotted line in (a) marks the lesioned area on
the retina (the retinal scotoma), and in (b) and (c) marks the
corresponding portion of V1 (the cortical scotoma). The cortical
scotoma is approximately as wide as the lateral connections, matching
artificial scotomas in biological experiments. Many of the neurons
that responded to the intact input do not receive sufficient
activation in the lesioned network and remain silent (because the
topography of the retinal preferences is not uniform around the edges,
some neurons inside the cortical scotoma still respond). Such changes
in activity disrupt the dynamic equilibrium, forcing the network to
reorganize.
|

