Click on the image to see a PDF version (for zooming in)
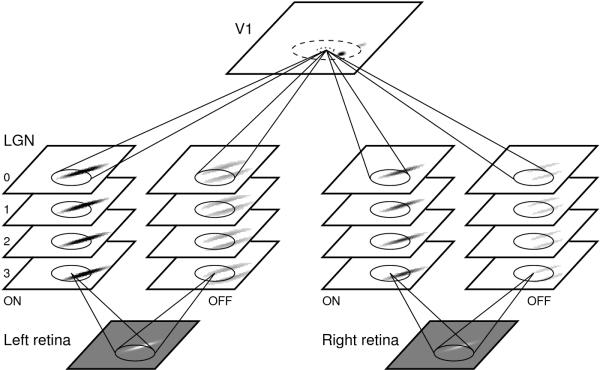
Fig. 5.26. LISSOM model of orientation, ocular dominance, and
direction selectivity. The architecture is a combination of the
LISSOM OD network of Figure 5.14 and the DR network of Figure
5.20. For each input movie, one retina is chosen randomly to be dimmer
than the other. The frames are then drawn on the retina one timestep
at a time, and propagated to the LGN sheets with the appropriate
lag. The V1 neurons receive input from all 16 LGN sheets
simultaneously, and settle the activation through lateral connections
as usual in LISSOM.
|