Click on the image to see a PDF version (for zooming in)
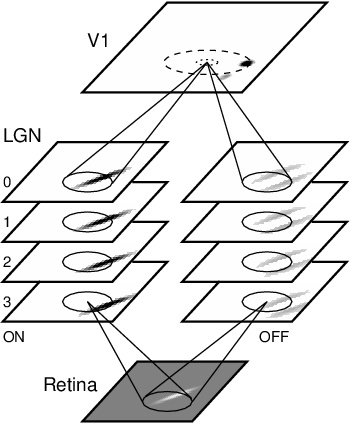
Fig. 5.20. LISSOM model of orientation and direction
selectivity. The architecture is similar to the LISSOM OR network,
except the ON and OFF channels consist of sheets of neurons with
different lag times (from 0 to 3 in this case). Moving input patterns
are drawn on the retina in discrete timesteps, like frames of a
movie. At the first timestep, the ON and OFF LGN cells with time lag 3
compute their activity. At each subsequent timestep, the input pattern
is moved slightly and LGN cells with lags 2, 1, and 0 each compute
their activity in turn. Once all LGN cells have been activated, the
initial V1 response is computed based on the responses on the eight
LGN sheets. The activity then spreads laterally within V1 as usual in
LISSOM.
|

