Click on the image to see a PDF version (for zooming in)
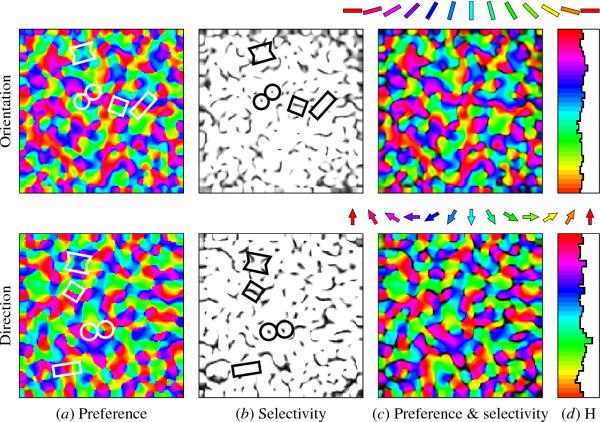
Fig. 5.22. Self-organized OR/DR map. The orientation (top row)
and direction (bottom row) maps in the LISSOM OR/DR model were
computed separately after self-organization. The orientation
preferences are coded using the color bar key on top, and the
direction preferences using the color arrow key in the
middle. Selectivity is shown in gray scale in both cases, with black
indicating low selectivity (as in Figure 5.9). (a) The network
represents both orientation and direction in smoothly varying maps
that contain all the features found in animal maps, such as linear
zones, pairs of pinwheels, saddle points, and fractures (outlined as
in Figure 2.4). (b) Most neurons become selective for specific
orientation and direction of motion, and are therefore nearly white in
the selectivity plots. (c) Overlaying the preference and selectivity
plots shows that regions of low selectivity occur near pinwheel
centers and along fractures in both maps. (d) The histograms are
essentially flat because the training inputs were unbiased. These
plots show that LISSOM can develop biologically realistic orientation
and direction maps through self-organization based on abstract input
patterns.
|

