Click on the image to see a PDF version (for zooming in)
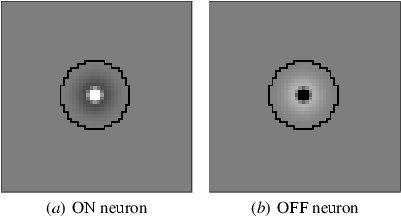
Fig. 4.2. Afferent weights of ON and OFF neurons in the LGN.
The receptive fields of a sample ON neuron and a sample OFF neuron,
both located at the center of the corresponding 36 × 36 LGN sheet, are
shown as gray-scale values on a 54 × 54 retina. The jagged black line
traces the anatomical boundary of the RF, that is, connections exist
only from retinal receptors located inside the boundary. Medium gray
represents zero weight, dark gray stands for inhibitory connections,
and light gray represents excitatory connections. Each RF shape is a
difference of two Gaussians, the center and the surround. The
Gaussians are normalized to have the same total strength, but the
center Gaussian concentrates that strength in a much smaller region;
in this example, &sigmac = 0.5 and &sigmas =
2. ON cells have an excitatory center and an inhibitory surround (a),
and OFF cells have an inhibitory center and an excitatory surround
(b), as in Figure 2.2a,b. These RFs perform edge detection at a
spatial frequency determined by the width of the center; they
highlight areas of the input image that have edges and lines, and do
not respond to large areas of constant illumination.
|

