Click on the image to see a PDF version (for zooming in)
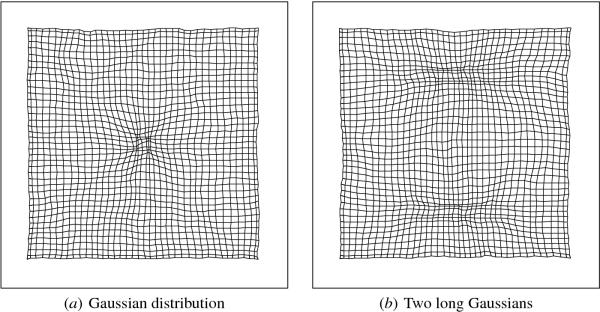
Fig. 3.7. Magnification of dense input areas. Whereas in Figure
3.6 the inputs were uniformly distributed over the receptor surface,
map (a) was trained with inputs appearing more frequently in the
middle, and map (b) with two such high-density areas diagonally from
the middle. More units are allocated to representing the dense areas,
which means that they are represented more accurately on the
map. Similar magnification is observed in biological maps.
|

