Click on the image to see a PDF version (for zooming in)
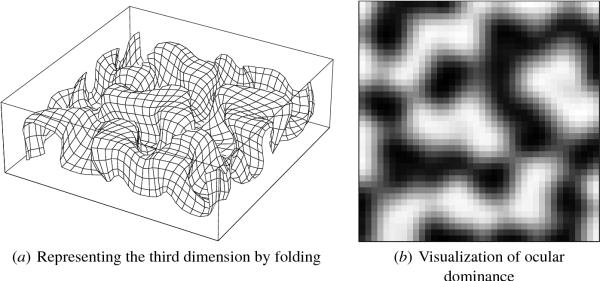
Fig. 3.10. Three-dimensional model of ocular dominance. The
model consists of a two-dimensional map of a three-dimensional space.
The first two dimensions can be interpreted as retinotopy and the
third dimension as ocular dominance (Ritter et al. 1991, 1992). In
(a), the input space is indicated by the box outline, and the weight
vectors of the map units are plotted in this space as a grid (as in
Figure 3.6). The map extends along the longer retinotopic dimensions
x and y, and folds in the smaller height dimension to approximate the
space. (b) The weight value for the height dimension is visualized
for each neuron: Gray-scale values from black to white represent
continuously changing values from low to high. The resulting pattern
resembles the ocular dominance stripes found in the visual cortex,
suggesting that they too could be the result of a self-organized
mapping of a three-dimensional parameter space.
|

