Click on the image to see a PDF version (for zooming in)
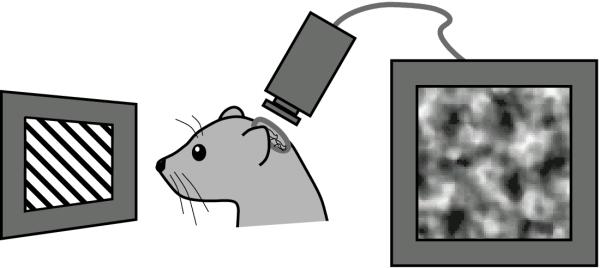
Fig. 2.3. Measuring cortical maps. Optical imaging techniques
allow neuronal preferences to be measured for large numbers of neurons
at once (Blasdel and Salama 1986). In such experiments, part of the
skull of a laboratory animal is removed by surgery, exposing the
surface of the visual cortex. Visual patterns are then presented to
the eyes, and a video camera records either light absorbed by the
cortex or light given off by voltage-sensitive fluorescent chemicals
that have been applied to it. Depending on the neural activity, there
will be small differences in the emitted or reflected light, and these
differences can be amplified by repeated presentations and
averaging. The results are an indirect measure of the average
two-dimensional pattern of neural activity resulting from a particular
stimulus. Measurements can then be compared between different stimulus
conditions, e.g. different orientations, determining which stimulus is
most effective at activating each small patch of neurons. Figure 2.4
and later figures in this chapter will show maps of orientation
preference computed using these techniques. Adapted from Weliky et
al. (1995).
|

