Click on the image to see a PDF version (for zooming in)
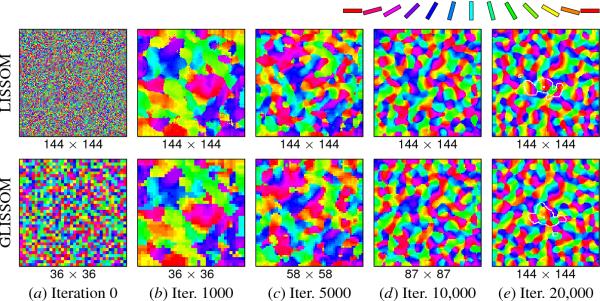
Fig. 15.7. Self-organization of LISSOM and GLISSOM orientation
maps. The GLISSOM map is gradually scaled so that by the final
iteration it has the same size as LISSOM. To make the scaling steps
more obvious, this example is based on the smallest acceptable initial
network; Figure 15.9 shows that results match even more closely for
larger initial networks. At each iteration, the features that emerge
in the GLISSOM map are similar to those of LISSOM except for
discretization differences. An animated demo of these
self-organization examples can be seen at ...
|

