Click on the image to see a PDF version (for zooming in)
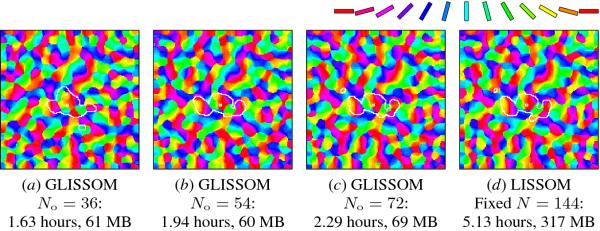
Fig. 15.9. Orientation maps in LISSOM and GLISSOM. Above the
minimum 36 × 36 initial network size, the final GLISSOM maps closely
match those of LISSOM, yet take much less time and memory to
simulate. Computation time increases smoothly as larger initial
networks are used, allowing a tradeoff between accuracy and
time. However, accurate maps are obtained substantially faster than
with LISSOM. As long as the initial networks are small compared with
the final maps, memory usage is bounded by the size of the final maps.
|

