Click on the image to see a PDF version (for zooming in)
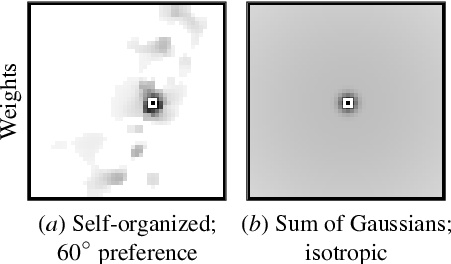
Fig. 14.1. Self-organized vs. isotropic lateral connections. In
(a), self-organized inhibitory lateral connection weights for a sample
neuron in the LISSOM orientation map are plotted in gray scale from
white to black (low to high); the small white square marks the neuron
itself. In (b), the connections of a sample neuron in the network with
isotropic long-range connections are shown. This network was
constructed by adding two isotropic Gaussians: The smaller Gaussian
was chosen as wide as the central peak in the self-organized weights,
and the larger to extend as far as the longest self-organized lateral
connections. Therefore, all neurons that are connected in the
self-organized network are also connected in the sum-of-Gaussians
network.
|

