Click on the image to see a PDF version (for zooming in)
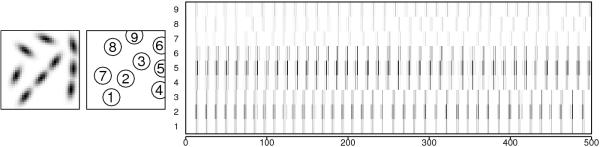
Fig. 13.10. Contour segmentation process. Input for the contour
segmentation experiment consisted of two contours, diagonal and
vertical, and three background elements. The same plotting conventions
as in Figure 13.6 were used to illustrate the MUAs of the areas that
responded to these inputs. The three bottom rows (1 to 3) correspond
to the diagonal contour, the three middle rows (4 to 6) to the
vertical contour, and the top three rows (7 to 9) to the background
elements. The MUA sequences within each contour are synchronized. On
the other hand, the MUA sequences of elements in different contours,
of elements in the background, and of contour and background elements
are desynchronized. In other words, the three areas representing the
same contour fire together while the areas responding to the other
contour and to the background are silent. Such an alternating
activation of neuronal groups ensures that each coherent object is
represented distinctly and not mixed with representations of other
objects. An animated demo of this process can be seen at ...
|

