Click on the image to see a PDF version (for zooming in)
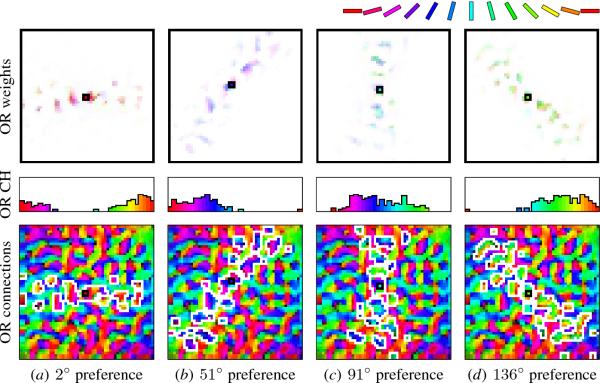
Fig. 11.5. Long-range lateral connections in GMAP. The
long-range excitatory lateral connection patterns for four sample
neurons in GMAP are shown on top, located in iso-orientation patches
as shown in the map below. Similar plotting conventions are used as in
Figure 5.12: The small black square identifies the neuron itself in
both plots, and the white outline on the map indicates the extent of
the lateral connections after self-organization and pruning; before
self-organization the lateral connections covered the whole map, as
shown by the black square outline on top. The color coding in the top
plots represents the target neuron's orientation preference,
selectivity, and connection strength, and the map below encodes
orientation and selectivity. The histogram in the middle shows the
distribution of the target neurons' orientation preferences. Each
neuron is most strongly connected to its closest neighbors; the
long-range connections are patchy and connect neurons with similar
orientation preferences. They extend longer than those in Figure 5.12
because more elongated input patterns were used during
self-organization. As in LISSOM, these connections extend along the
orientation preference of the source neuron: (a) 2o red,
(b) 51o purple, (c) 91o light blue, and (d)
136o light green. They are narrow around the neuron but
wider farther away. As will be seen in Chapter 13, specific connection
patterns like these are crucial for perceptual grouping such as
contour integration.
|

