Click on the image to see a PDF version (for zooming in)
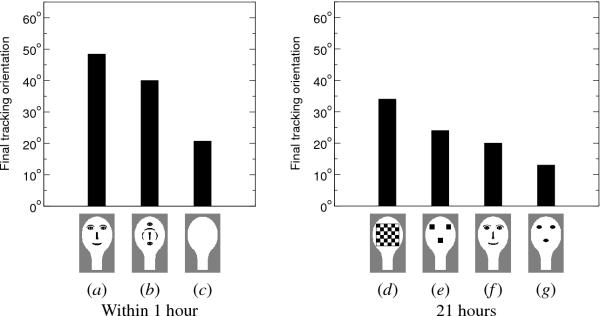
Fig. 10.2. Face preferences in newborns. Using the procedure
from Figure 10.1, Johnson et al. (1991) measured responses of human
newborns to a set of head-sized schematic patterns. The graph at left
gives the result of a study conducted within 1 hour after birth; the
one at right gives results from a separate study with newborns an
average of 21 hours old. Each bar indicates how far the newborns
tracked the image pictured below with their eyes on average. Because
the procedures and conditions differed between the two studies, only
the relative magnitudes should be compared. Overall, the study at left
shows that newborns respond to facelike stimuli (a,b) more strongly
than to simple control conditions (c); all comparisons were
statistically significant. This result suggests that face processing
is in some way genetically coded. In the study at right, the
checkerboard pattern (d) was tracked significantly farther than the
other stimuli, and pattern (g) was tracked significantly less far; no
significant difference was found between the responses to (e) and (f
). The ovals are not as visible to the newborn as the square dots, and
the checkerboard stimulates newborn's low-level visual system
extremely well. These results suggest that simple three-dot patterns
can invoke face preferences much like facelike patterns do, but
low-level visual stimulation can also have a significant
effect. Replotted from Johnson et al. (1991).
|

