Click on the image to see a PDF version (for zooming in)
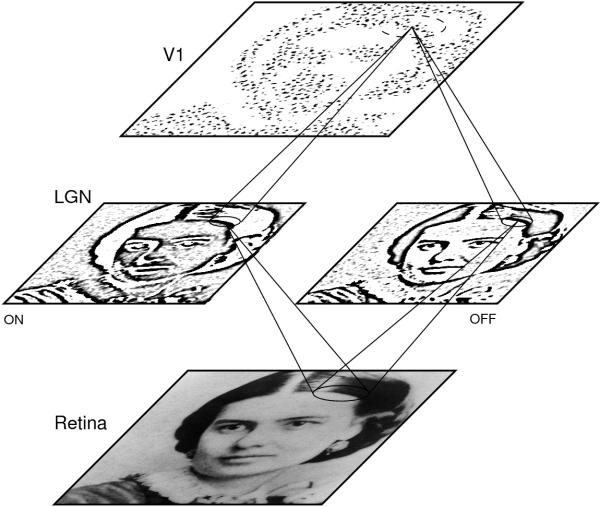
Fig. 1.4. Basic LISSOM model of the primary visual cortex. The
core of the model consists of a two-dimensional array of computational
units representing columns in V1. These units receive input from the
retinal receptors through the ON/OFF channels of the LGN, and from
other columns in V1 through lateral connections. The solid circles and
lines delineate the receptive fields of two sample units in the LGN
and one in V1, and the dashed circle in V1 outlines the lateral
connections of the V1 unit. The LGN and V1 activation in response to a
sample input on the retina is displayed in gray-scale coding from
white to black (low to high). The V1 responses are patchy because each
neuron is selective for a particular combination of image features
(Figure 1.1), and only certain combinations exist in the image. This
basic LISSOM model will be used in Part II to understand input-driven
self-organization, cortical plasticity, and functional effects of
adapting lateral connections. In Part III, the model is further
extended with subcortical and higher level areas to study prenatal and
postnatal development, and in Part IV, with binding and segmentation
circuitry in V1 to model perceptual grouping.
|

