Click on the image to see a PDF version (for zooming in)
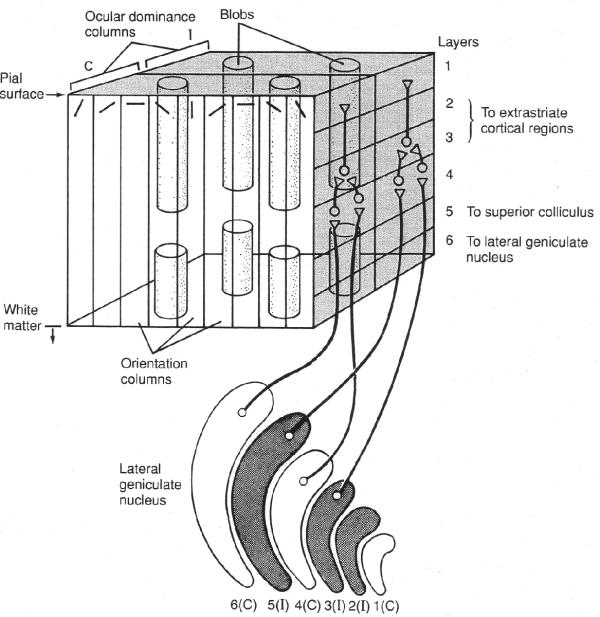
Fig. 1.1. Columnar organization of the primary visual cortex.
This classic diagram illustrates an example patch of V1, responsive to
one retinotopic location in the visual field. This patch includes an
ocular dominance column for each eye, and a set of orientation columns
within each ocular dominance column. Orientation preference changes
along the length of the area shown, and ocular dominance along its
width. Vertically, the receptive field properties are the
same. Structures such as blobs, which analyze color, are scattered
throughout the columns. Reprinted with permission from Kandel et al. (1991), copyright
1991 by McGraw-Hill.
|

