Click on the image to see a PDF version (for zooming in)
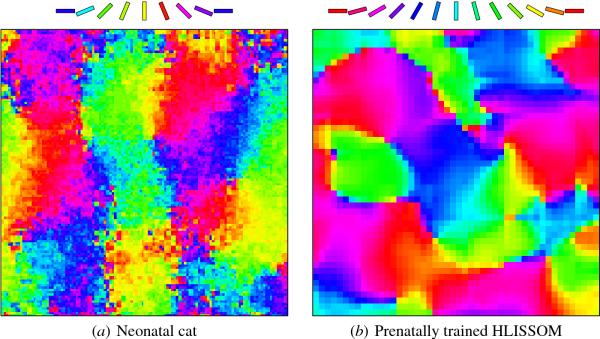
Fig. 9.2. Prenatal orientation maps in animals and in HLISSOM.
(a) A 1.9 mm × 1.9 mm section measured through optical imaging in a
2-week-old binocularly deprived kitten, i.e. a kitten without prior
visual experience. The map is not as smooth as in the adult, and many
of the neurons are not as selective (not shown), but the map already
has iso-orientation patches, linear zones, pairs of pinwheels, saddle
points, and fractures (detail of a figure by Crair et al. 1998,
reprinted with permission, copyright 1998 by the American Association
for the Advancement of Science). (b) The central 30 × 30 region of the
"Noisy disks" orientation map from Figure 9.1. The overall
organization is very similar in the two maps, suggesting that prenatal
training with internally generated patterns may be responsible for the
observed maps at birth.
|

