Click on the image to see a PDF version (for zooming in)
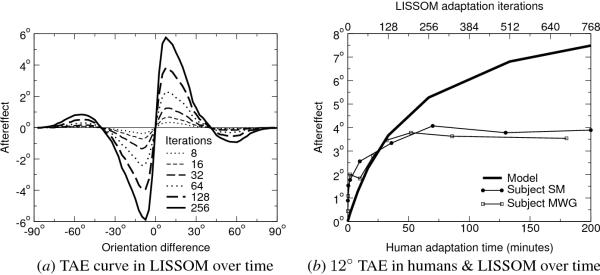
Fig. 7.6. Tilt aftereffect over time in humans and in LISSOM.
Each curve in (a) shows the average TAE of the LISSOM model with a
different amount of adaptation. The TAE has the same S-shape
throughout, and its magnitude increases monotonically. Similar
comprehensive data are not available on humans, but a vertical slice
corresponding to the peak in this graph has been measured, as is shown
in (b): The thin lines depict the direct TAE for 12o
orientation difference vs. adaptation time for two human subjects SM
and MWG, averaged over five trials (Greenlee and Magnussen 1987). For
comparison, the thick line shows the corresponding TAE for the LISSOM
model, averaged over nine trials. The adaptation time in LISSOM is
measured in iterations, scaled to match the human plots as well as
possible. The direct TAE increases approximately logarithmically in
both LISSOM and humans; however, it does not saturate in LISSOM like
it does in humans, suggesting that human adaptation faces additional
limitations for long adaptation times. Reprinted from Bednar and
Miikkulainen (2000b).
|

