Click on the image to see a PDF version (for zooming in)
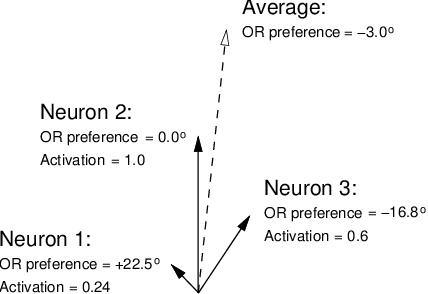
Fig. 7.3. Measuring perceived orientation as vector sum. The
activations and orientations of three neurons are shown as vectors
(solid lines). The angle of each vector is twice the orientation
preference of that neuron, in order to make the vector orientation for
0o and 180o identical. The magnitude of each
vector represents the activation level, to ensure that the encoding
primarily reflects those neurons that are most active. The sum of
these vectors is shown as a dashed line. The perceived orientation is
half of the angle of the dashed vector.
|

