Click on the image to see a PDF version (for zooming in)
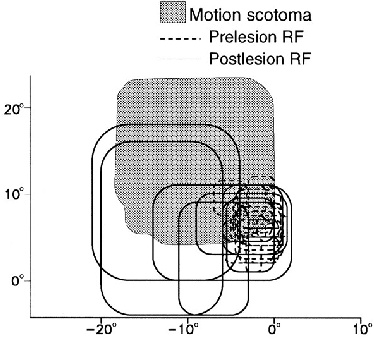
Fig. 6.2. Reorganization of receptive fields after a cortical
lesion. The receptive fields measured through microelectrode
recording before and after lesion in the middle temporal (MT) area of
a macaque monkey are shown in visual space; the axes indicate angles
in the visual field. The retinal area represented by the lesioned
cortex is shown in gray (labeled "Motion scotoma"). Before the lesion,
receptive fields of neurons immediately outside the cortical lesion
boundary (dashed rounded rectangles) responded to the lower right
corner of the gray area. However, 3 hours to 3 days after the lesion,
the receptive fields (solid rounded rectangles) became larger and
covered a larger portion of the scotoma, suggesting that neurons
outside the lesion boundary were compensating for the loss of
function. Reprinted with permission from Sober et al. (1997),
copyright 1997 by the American Physiological Society.
|

