Click on the image to see a PDF version (for zooming in)
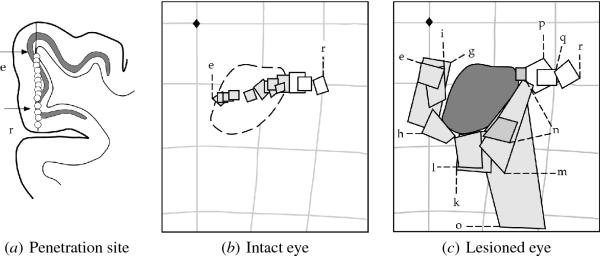
Fig. 6.1. Reorganization of receptive fields after a retinal
lesion. The receptive field distributions in the intact and the
lesioned eye of a single adult cat are plotted in visual space 4-8
hours after a retinal lesion in one eye. (a) The electrode penetration
site (vertical line) is shown along with the locations (open circles)
of neurons whose receptive fields are plotted in (b) and (c). The
arrows on the left mark the boundary of the cortical region that
represennts the retinal lesion. The neurons are labeled "e" to "r"
from top to bottom and span a distance of about 5 mm. (b) The
receptive fields in the visual space of the intact eye are shown as
rectangles labeled "e" to "r" according to the neuron's position along
the penetration site. The grid lines are spaced 10o apart
and the black diamond marks the area centralis. The dashed contour in
the middle marks the area that corresponds to the scotoma in the
lesioned eye; the receptive fields within this region are colored
gray. The receptive fields show an orderly progression from left to
right. In another penetration before the lesion (not shown), a
distribution similar to that in (b) was observed in both eyes;
therefore, the distribution in the intact eye suggests how the
receptive fields in the lesioned eye were located before the
lesion. (c) In the lesioned eye, the scotoma is shown as a dark gray
area. The receptive fields that used to respond to the area inside the
scotoma (the gray rectangles labeled "e" to "o") have moved outward,
and now represent the perilesion area. Several of them (e.g. "g", "h",
and "m") have also aligned with the scotoma boundary. As a result, the
unresponsive area in the cortex (a perceptual blind spot) has
disappeared, even though damage persists in the retina. Reprinted with
permission from Calford et al. (1999), copyright 1999 by the Royal
Society of London.
|

