Click on the image to see a PDF version (for zooming in)
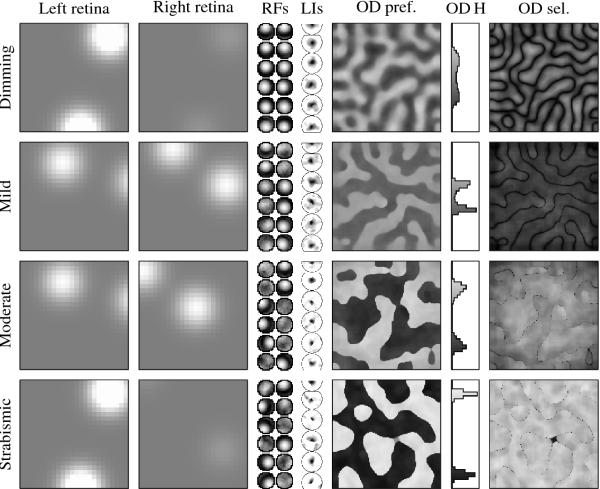
Fig. 5.19. Effect of disparity on ocular dominance maps. Each
row presents a different simulation using the same network but a
different degree of disparity between the inputs in the two eyes. From
left to right, each row shows a retinal activation (left and right
eyes), final RFs of a set of sample neurons, their lateral
connections, the OD preference map, its histogram, and the OD
selectivity map. For comparison, the results from brightness
differences are reproduced in the top row (labeled "Dimming"), and the
results from strabismic maps in the bottom row. The main result is
that OD maps can be obtained from disparity differences (with no
brightness differences), but the results do not match animal maps
well. Small amounts of disparity (scatter ss = 0.2) result
in unrealistically clear boundaries between stripes even with
relatively weak OD preferences (row "Mild"), as is evident in the
histogram. Moderate disparity (ss = 0.4; row "Moderate")
approaches the strabismic results, with strongly monocular RFs, sharp
stripe boundaries, and connections only to neurons that prefer the
same eye, unlike in normal animals. These results suggest that ocular
dominance patterns can result from differences in either position or
brightness, but brightness differences lead to maps that more closely
match those found in animals.
|

