Click on the image to see a PDF version (for zooming in)
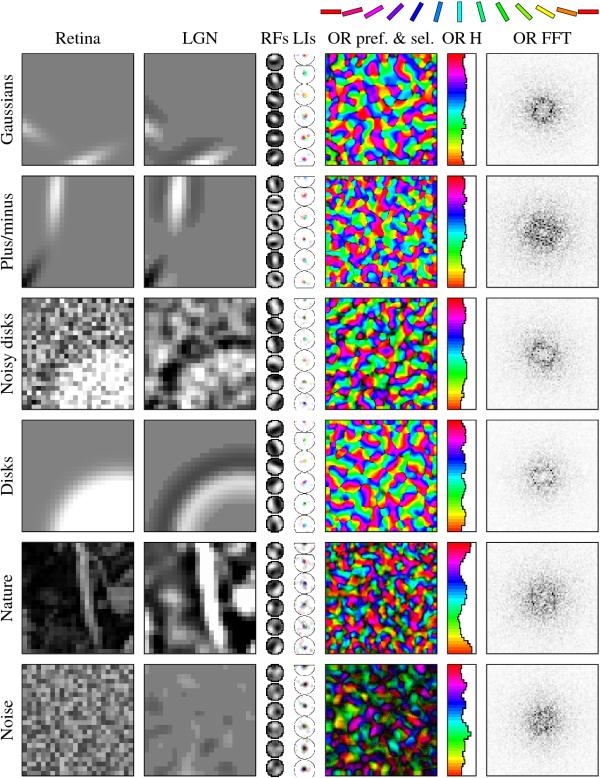
Fig. 5.13. Effect of training patterns on orientation maps. In
this and later similar figures, the rows represent different
self-organization experiments. Each row typically shows a sample
retinal activation, the LGN response to that activation, final
receptive fields (ON-OFF) of sample neurons, their lateral inhibitory
connections (LIs), the orientation preference and selectivity map, the
orientation preference histogram, and the fast Fourier transform (FFT)
of the orientation preferences. The RFs and LIs are drawn to a smaller
scale than LGN and V1. For clarity, most OR models are based on
abstract input patterns like the oriented Gaussians in the top two
rows. However, OR maps develop robustly with a wide variety of input
patterns, including large circular patterns (middle rows) and natural
images (second row from the bottom; image from a dataset by Shouval et
al. 1996, 1997). Maps develop even with random noise (bottom row),
although such maps are relatively unselective and the RFs do not have
realistic profiles. Spatial structure is therefore necessary in LISSOM
for biologically realistic maps to form.
|

