Click on the image to see a PDF version (for zooming in)
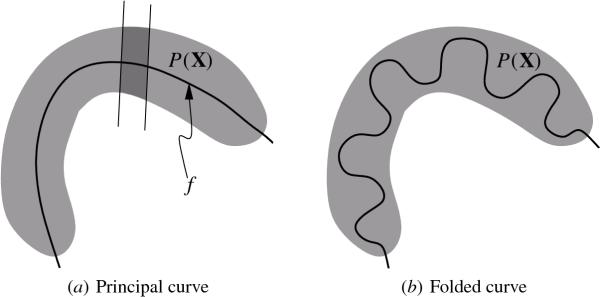
Fig. 3.9. Approximating nonlinear distributions with principal
curves and folding. (a) The principal curve passes through the
middle of the data distribution, providing a more detailed
representation of nonlinear distributions than principal
components. Each point on the curve is positioned at the center of
gravity of the part of the distribution enclosed within two
infinitesimally close normals (Ritter et al. 1992). (b) If a more
detailed representation of the thickness of the distribution is
desired, the curve can be folded in the higher dimension.
|

