Click on the image to see a PDF version (for zooming in)
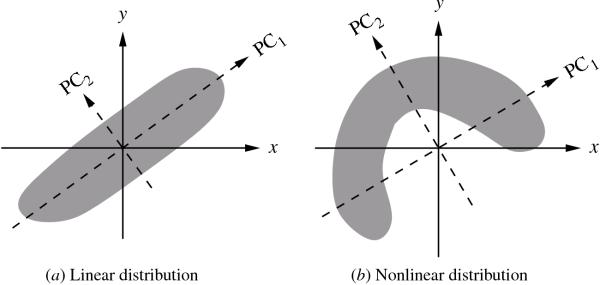
Fig. 3.8. Principal components of data distributions. In
principal component analysis, the data originally represented in (x,
y) coordinates are transformed into the principal component coordinate
system: The first principal component (PC1) aligns with the
direction of maximum variance in the data, and the second
(PC2) is orthogonal to it. The lengths of the axes reflect
the variance along each coordinate dimension. (a) The two-dimensional
distribution has a linear structure, and the first component alone is
a good representation. However, with a nonlinear distribution (b), PCA
does not result in a good lower dimensional representation, even
though the distribution lies on a one-dimensional curve.
|

