Click on the image to see a PDF version (for zooming in)
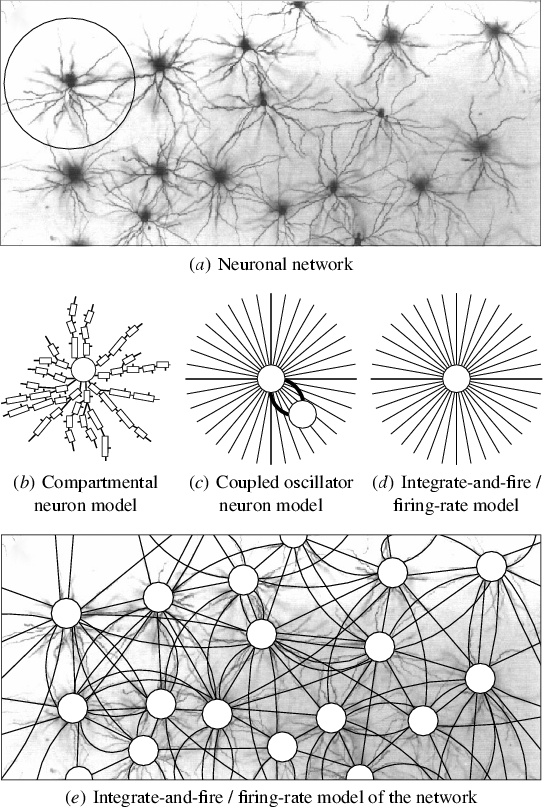
Fig. 3.1. Computational abstractions of neurons and networks.
Biological neurons can be modeled at different levels of abstraction
depending on the scale of the phenomena studied. (a) A microscopic
image of pyramidal cells in a 1.4 mm × 0.7 mm area of layer III in
macaque temporo-occipital (TEO) area, injected individually with
Lucifer Yellow (reprinted with permission from Elston and Rosa 1998,
copyright 1998 by Oxford University Press; circle added). Although
this technique shows only a fraction of the neurons in a single
horizontal cross-section, it demonstrates the complex structure of
individual neurons and their connectivity. (b) A detailed
compartmental model of the top left neuron (circled). Each compartment
represents a small segment of the dendrite, and connections are
established on the small dendritic spines, shown as line segments. (c)
A coupled oscillator model of the neuron, consisting of an excitatory
and an inhibitory unit with recurrent coupling, and weighted
connections with other neurons in the network. (d) A model where a
single variable describes the activation of the neuron, corresponding
to either the membrane potential (in the integrate-and-fire model), or
the average number of spikes per unit time (in the firing-rate
model). (e) A high-level model of a neuronal network. With the more
abstract neurons, it is possible to simulate a number of neurons and
connections, allowing us to study phenomena at the level of networks
and maps.
|

