Click on the image to see a PDF version (for zooming in)
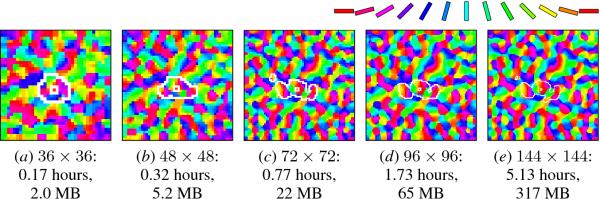
Fig. 15.3. Scaling cortical density. Five LISSOM orientation
maps from networks with different densities are shown. The parameters
for each network were first calculated using Equation 15.3, and each
network was then trained independently on the same random stream of
input patterns. The number of connections in these networks ranged
from 2 × 10⁶ to 3 × 10⁸ (requiring 2
MB to 317 MB of memory), and the simulation time from 10 minutes to 5
hours. Despite this wide range of simulation scales, the final
organized maps are both qualitatively and quantitatively similar, as
long as their size is above a certain minimum (about 64 × 64 in this
case). Larger networks take significantly more memory and simulation
time, but offer greater detail and allow multiple dimensions such as
orientation, ocular dominance, and direction selectivity to be
represented simultaneously.
|

