Click on the image to see a PDF version (for zooming in)
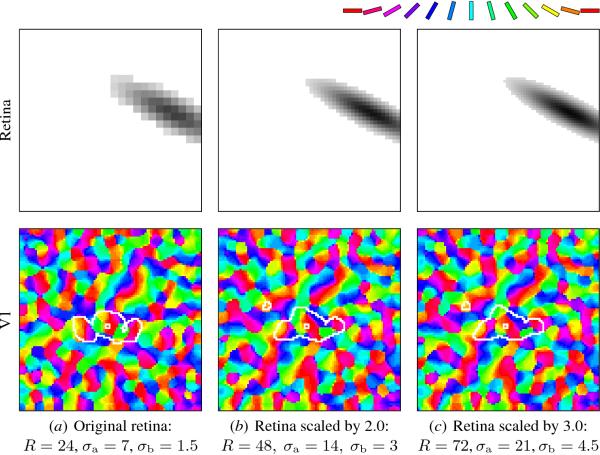
Fig. 15.2. Scaling retinal density. Each column shows a LISSOM
orientation map from one of three matched 96 × 96 networks with
retinas of different densities. The parameters for each network were
calculated using Equation 15.2, and each network was then trained
independently on the same random stream of input patterns. The size of
the input pattern in retinal units grows as the retinal density is
increased, but its size as a proportion of the retina remains
constant. All of the resulting maps are similar as long as R is large
enough to represent the input faithfully, with almost no change above
R = 48. Thus, a low value can be used for R in practice. Such scaling
of retinal density is useful for modeling species and areas with
higher receptor resolution, and for matching the cortical
magnification factor of a model to that of a particular species.
|

