Click on the image to see a PDF version (for zooming in)
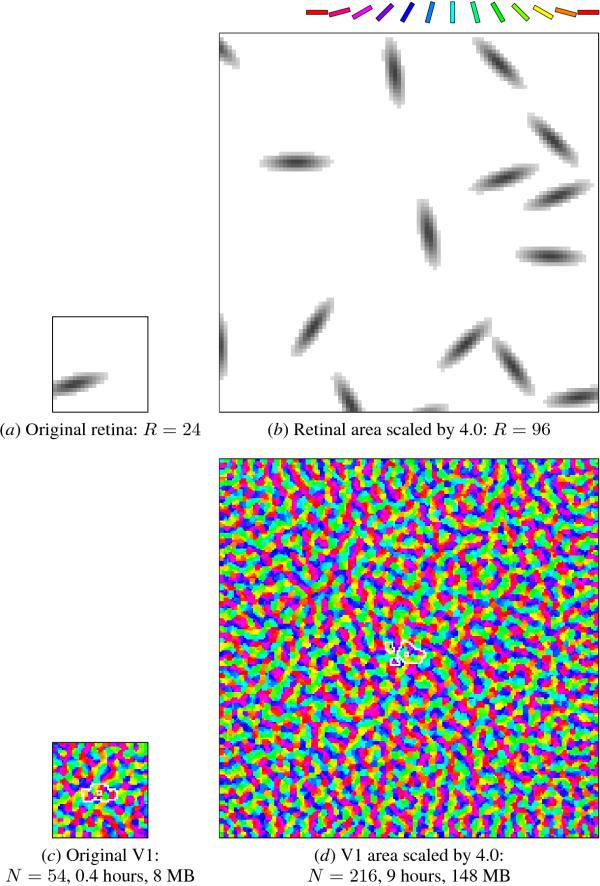
Fig. 15.1. Scaling retinal and cortical area. The small retina
(a) and V1 (c) was scaled to a size 16 times larger (b,d) using
Equation 15.1. To make it easier to compare map structure, especially
in early iterations, the OR maps are plotted without selectivity in
this chapter. The lateral inhibitory connections of one central
neuron, marked with a small white square, are indicated in white
outline. The simulation time and the number of connections scale
approximately linearly with the area, and thus the larger network
takes about 16 times more time and memory to simulate. For discrete
input patterns like these oriented Gaussians, it is necessary to have
more patterns to keep the total learning per neuron and per iteration
constant. Because the inputs are generated randomly across the retina,
each map sees a different stream of inputs, and so the patterns of
orientation patches on the final maps differ. The area scaling
equations are most useful for developing a model with a small area and
then scaling it up to eliminate border effects and to simulate the
full area of a corresponding biological preparation.
|

