Click on the image to see a PDF version (for zooming in)
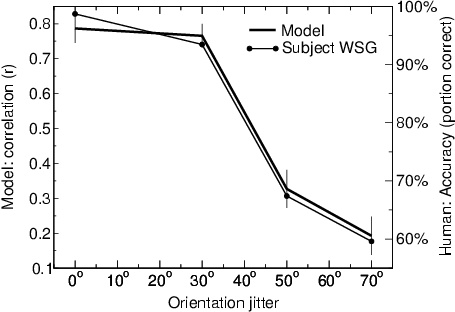
Fig. 13.7. Contour integration performance in humans and in
PGLISSOM. The model's performance was measured as the average
correlation coefficient between the MUA sequences in the salient
contour, calculated over two trials, each with a different input
example (left y axis). Human performance was measured as the
percentage of correctly identified contours (right y axis; data by
Geisler et al. 2001, root-mean-square (RMS) amplitude 12.5, fractal
exponent 1.5, which is the closest match with the PGLISSOM input
configuration). The x-axis is the orientation jitter in degrees, and
the error bars indicate ±1 SEM in the model (no error measures were
published for the human data). In both humans and the model, contour
integration is robust up to 30o, but quickly breaks down as
the orientation jitter increases (the difference between
30o and 50o is significant with p <
10-4; the other differences are not significant with p >
0.1).
|

