Click on the image to see a PDF version (for zooming in)
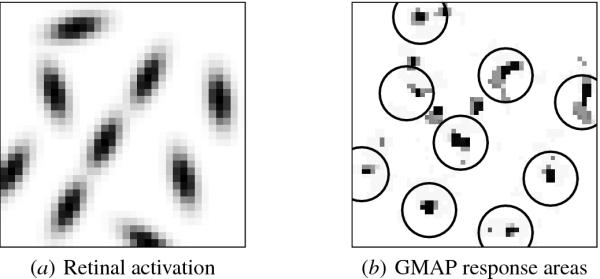
Fig. 13.5. Measuring local response as multi-unit activity. (a)
An example contour integration input, consisting of nine contour
elements with different positions and orientations on the retina. Each
element is an oriented Gaussian of length &sigmaa = 1.9 and
width &sigmab = 1.2. The firing rates of the retinal
receptors are set according to these Gaussian values, plotted in gray
scale from white to black (low to high). (b) The resulting activations
of the GMAP neurons, measured as a leaky average firing rate with a
0.92 decay rate. The circles indicate areas where separate MUA values
are measured. Each area is centered on a neuron whose receptive field
is centered on one of the contour elements and whose orientation
preference is the same as the element's orientation; due to local
distortions in the retinotopic mapping, the circle's center in V1 is
sometimes slightly displaced from the element's center on the
retina. A few neurons outside the circles are also activated, driven
by simultaneous input from two different contour elements. The circle
radius is chosen such that the spurious activation is not included in
the MUA measurements.
|

