Click on the image to see a PDF version (for zooming in)
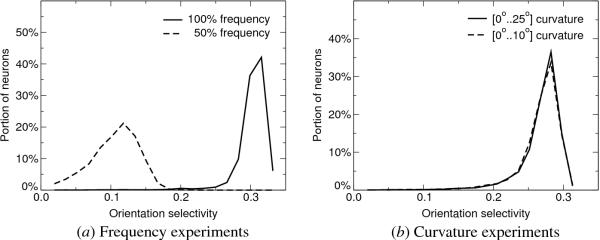
Fig. 13.20. Orientation selectivity in SMAP with different input
distributions. For each of the four networks, the selectivity of
neurons in the SMAP was measured (as described in Appendix G.1.3) and
plotted as a histogram; GMAP selectivities were similar and are not
shown. (a) The histogram for the 100% presentation frequency peaks at
around 0.32, and that of the 50% frequency around 0.12, suggesting
that the responses of the high-frequency network are sparser but
stronger for specific inputs. (b) The histogram for the high curvature
range [0o..25o] and the low curvature range
[0o..10o] are almost identical. Given that the
orientation preferences were also almost identical, any differences in
their performance are likely to be due to the lateral connections.
|

