Click on the image to see a PDF version (for zooming in)
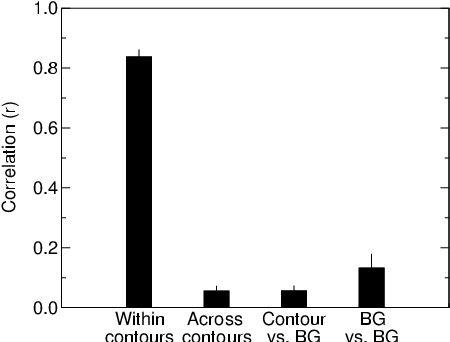
Fig. 13.11. Contour segmentation performance. The average
correlation coefficients between two MUA sequences within the same
contour, across different contours, between contour and background,
and within the background are plotted, calculated over two trials. The
error bars indicate ±1 SEM. The MUA sequences within the same contour
are highly correlated, whole those belonging to different contours or
the background are not (the difference is significant with p <
10-10). This result demonstrates quantitatively that
neurons within each contour form a synchronized group, whereas neurons
responding to different contours are desynchronized.
|

