Click on the image to see a PDF version (for zooming in)
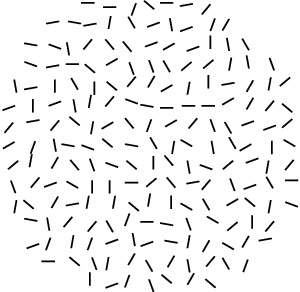
Fig. 13.1. Demonstration of contour integration. Look briefly
at the circular area fill with line segments above; a continuous
contour from top left to the right and slightly down should
immediately emerge. This process is called contour integration: A good
continuation of contour elements leads to a vivid perception of a
single object. This function is believed to arise automatically in the
orientation map of V1, mediated by lateral connections (Section
13.1.1).
|

