Click on the image to see a PDF version (for zooming in)
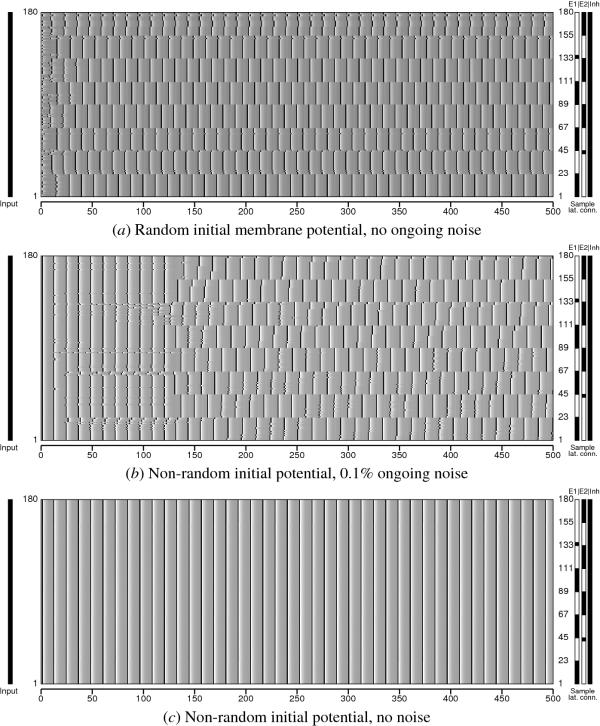
Fig. 12.5. Effect of noise on desynchronization. A network of
180 neurons with both excitatory and inhibitory lateral connections
was simulated for 500 iterations. The network was divided into two
groups, as in the experiment of Figure 12.4. The first group (E1)
consisted of neurons [1..22], [45..66], [89..110], and [133..154], and
the second group (E2) of neurons [23..44], [67..88], [111..132], and
[155..180]. The excitatory lateral connections were limited to the
neurons in the same group within a radius of 90; the inhibitory
connections were global. To illustrate, the plots at right show the
lateral connections of neuron 45 in E1 and 132 in E2. (a) The membrane
potential of each neuron was uniformly randomly initialized, and no
noise was added afterward. The symmetry is broken and the two groups
are separated as expected. (b) The membrane potentials initially were
the same, but perturbed throughout the simulation by adding 0.1% of
uniformly random noise. The neurons within the same group are
synchronized at the same time as the two groups are
desynchronized. (c) Without any noise (initial or continual), the
symmetry was not broken and the entire network remained
synchronized. A small amount of noise is therefore essential for
proper desynchronization to occur.
|

