Click on the image to see a PDF version (for zooming in)
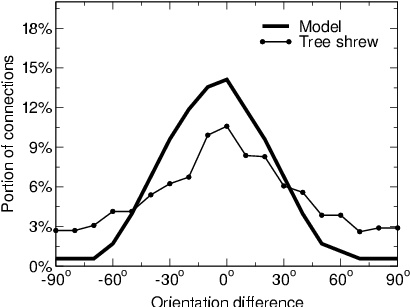
Fig. 11.7. Distribution of lateral connections in animals and in
PGLISSOM. In the tree shrew V1, biocytin was injected in the cell
body of seven different neurons, and the projections going to neurons
of different orientation preferences were counted. The thin line with
circles shows the median percentage of connections for each difference
(adapted from Bosking et al. 1997). In the GMAP, the percentage of
connections to neurons with different orientations were similarly
counted (after pruning); the median over all neurons in the map is
shown as the thick line. Both plots peak at 0o, and quickly
fall off as the orientation differences become larger (this effect is
slightly exaggerated in the model because in this experiment it was
trained on straight elongated Gaussians only; cf. Section 13.4.2). In
other words, strong excitatory lateral connections mostly link neurons
with similar orientation tuning both in the model and in animals.
|

