Click on the image to see a PDF version (for zooming in)
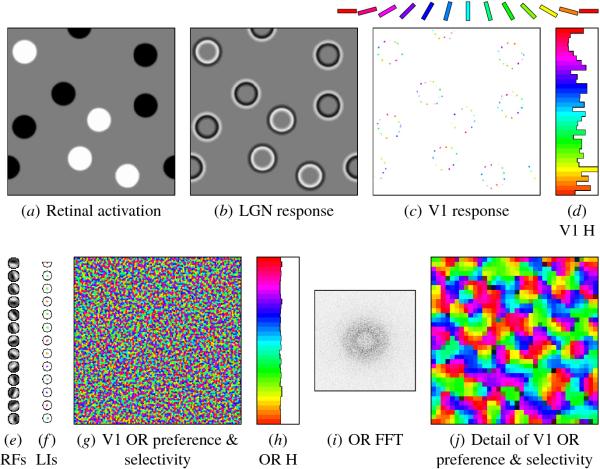
Fig. 10.4. Self-organization of the scaled-up orientation map.
These figures show a scaled-up version of the "Disks" simulation from
Figure 9.1, eight times wider and eight times
taller. At this scale, each input includes multiple disks (a), the
afferent weights of each neuron span only a small portion of the
retina (drawn to scale in e) and the lateral weights only a small part
of V1 (drawn to scale in f ), and the orientation map has many more
orientation patches (g). Its Fourier transform (i) is still
ring-shaped and its OR histogram (h) flat. Zooming in on the central
36 × 36 portion of this 288 × 288 map, plot (j) also shows
that the local structure and selectivity of the map are similar to
those in Section 9.2. The map appears blockier because the neuron
density was reduced to the smallest acceptable value so that the
network would be practical to simulate. Plot (c) shows that the
orientation preference of each neuron that responds to the input
(plotted as in Figure 6.5) is still a good match
to the orientation of the input at that retinal location, and the
histogram of the responses is unbiased, although noisy (d). Thus, this
network is a reasonable approximation to a large area of V1 and the
retina.
|

