Click on the image to see a PDF version (for zooming in)
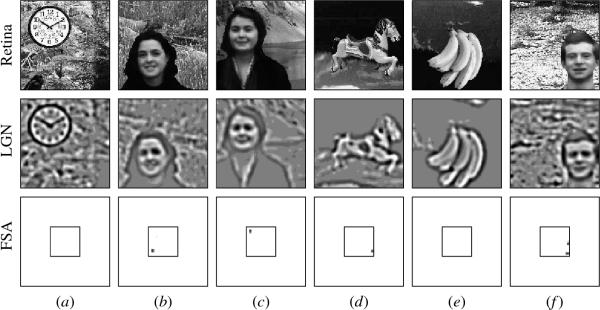
Fig. 10.14. Example postnatal training presentations. The top
row shows six randomly generated images drawn on the retina during
postnatal learning. Each image contains a foreground item chosen
randomly from the images in Figure 10.13. The foreground item was
overlaid onto a random portion of an image from a database of 58
natural scenes (National Park Service 1995), at a random location and
at a nearly vertical orientation (drawn from a normal distribution
around vertical, with &sigma = &pi / 36 radians). The second row shows
the LGN response to each of these sample patterns, and the bottom row
the FSA response at the start of postnatal training. The FSA responds
to groups of dark spots on the retina, such as the eyes and mouths in
(b), (c), and (f) and the horse's dark markings in (d). Subsequent
learning in the FSA will be driven by these patterns of
activity. Because the prenatal training biases the activity patterns
toward faces, postnatal self-organization will also be biased toward
faces, as is shown in Figure 10.15.
|

