Click on the image to see a PDF version (for zooming in)
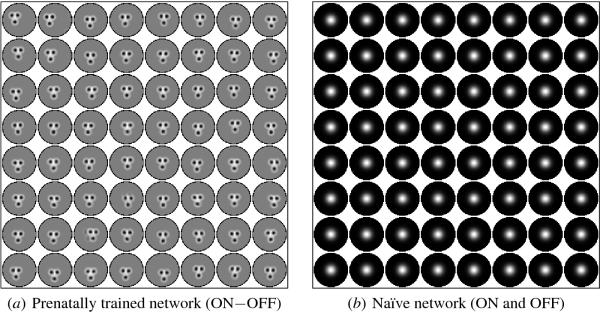
Fig. 10.12. Initial afferent weights across prenatally trained and
naive FSA networks. The RFs of every third neuron horizontally and
vertically in each network are plotted. For the prenatally trained
network (a), the RFs were visualized by subtracting the OFF weights
from the ON (as in Figure 10.11). The RF patterns are roughly similar
to faces, like the RFs of the prenatal FSA trained with V1 input
(Section 10.2). In contrast, the RFs of the naive network (b) were
initially uniformly Gaussian; the ON and OFF weights were
identical. These networks form an unequal starting point for postnatal
learning of faces, as will be shown in later figures.
|

