Click on the image to see a PDF version (for zooming in)
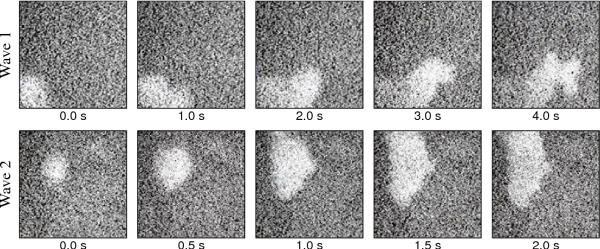
Fig. 1.2. Spontaneous activity in the retina. Each of the
frames shows calcium concentration imaging of approximately 1
mm2 of newborn ferret retina; the plots are a measure of
how active the retinal cells are. Light gray indicates areas of
increased activity. This activity is spontaneous (internally
generated), because the photoreceptors have not yet developed at this
time. From left to right, the frames on the top row form a 4-second
sequence showing the start and expansion of a wave of activity. The
bottom row shows a similar wave 30 seconds later. Later chapters will
show that this type of correlated activity can explain how orientation
selectivity develops before eye opening. Reprinted with permission
from Feller et al. (1996),
copyright 1996 by the American Association for the Advancement of
Science; gray scale reversed.
|

